Search Volume Metrics
Search volume is one of the metrics in the Stats dashboard that displays the average number of searches for all keywords in your domain each month. Historical data will be available within a month since you first added keywords and will be updated every month.
We obtain search volume datasets from third-party providers. We then pass this data on to Sequence users in an attractive and easy-to-understand visualization. In this way, you can monitor how many searches your domain has for keywords and how searches change over time.
To access search volume metrics information for each active view, please select the Search Volume option on the Stats dashboard. Check out the following guideline to understand the search volume data visualization presented by Sequence.
Types of Graphs in Search Volume Metrics
Search volume metrics are presented in the form of column graphs, line graphs, and line graphs with pointers to make it easier for users to understand the displayed data. Sequence also allows users to change the data visualization from one chart type to another, via the Switch Component Type option.
Column Chart
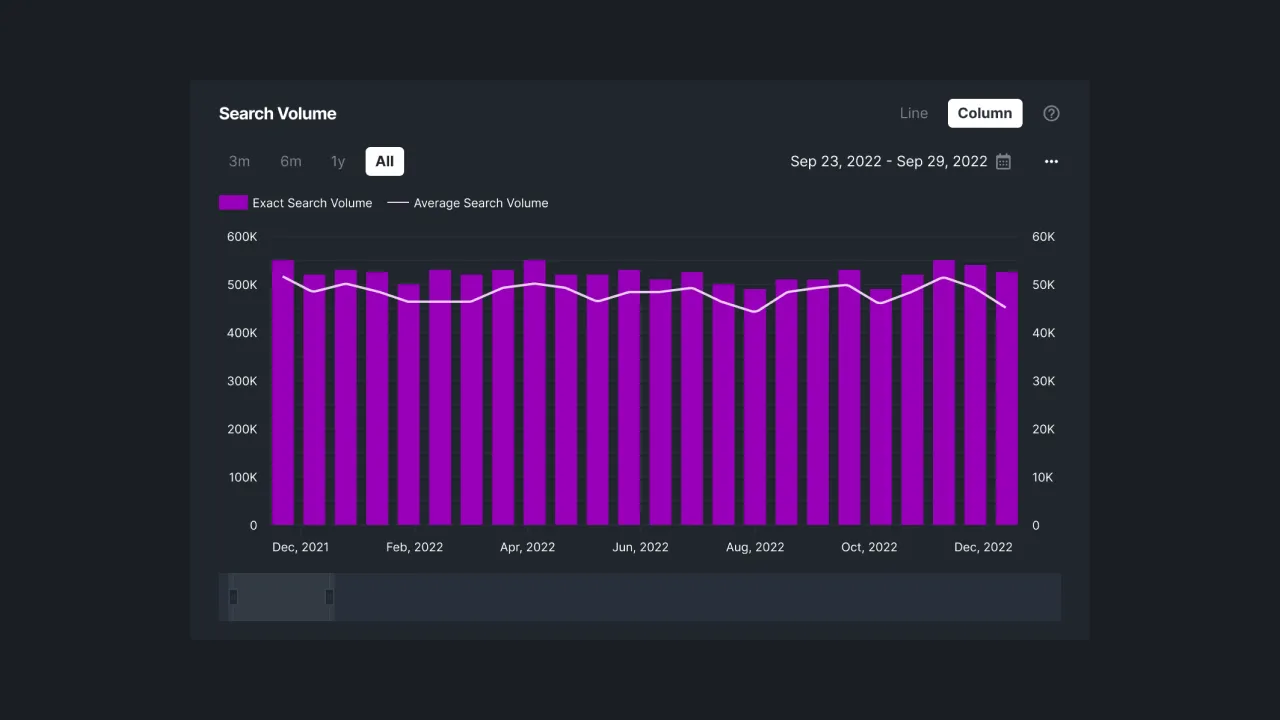
Column charts allow you to display data based on a specific time period by pressing the calendar icon on the top right side of the graph. You can also choose to display data for the last few months (6 months, 12 months, 24 months, or all data) via the Zoom option on the top left.
The vertical line in the column chart shows the month and year the search volume data was collected, while the horizontal line shows the range of keyword search volume values. Hover your mouse over one of the columns to display the average details for all your keywords in search engines.
 |
|---|
| Figure 1 - Search Volume Column Chart |
Line Chart
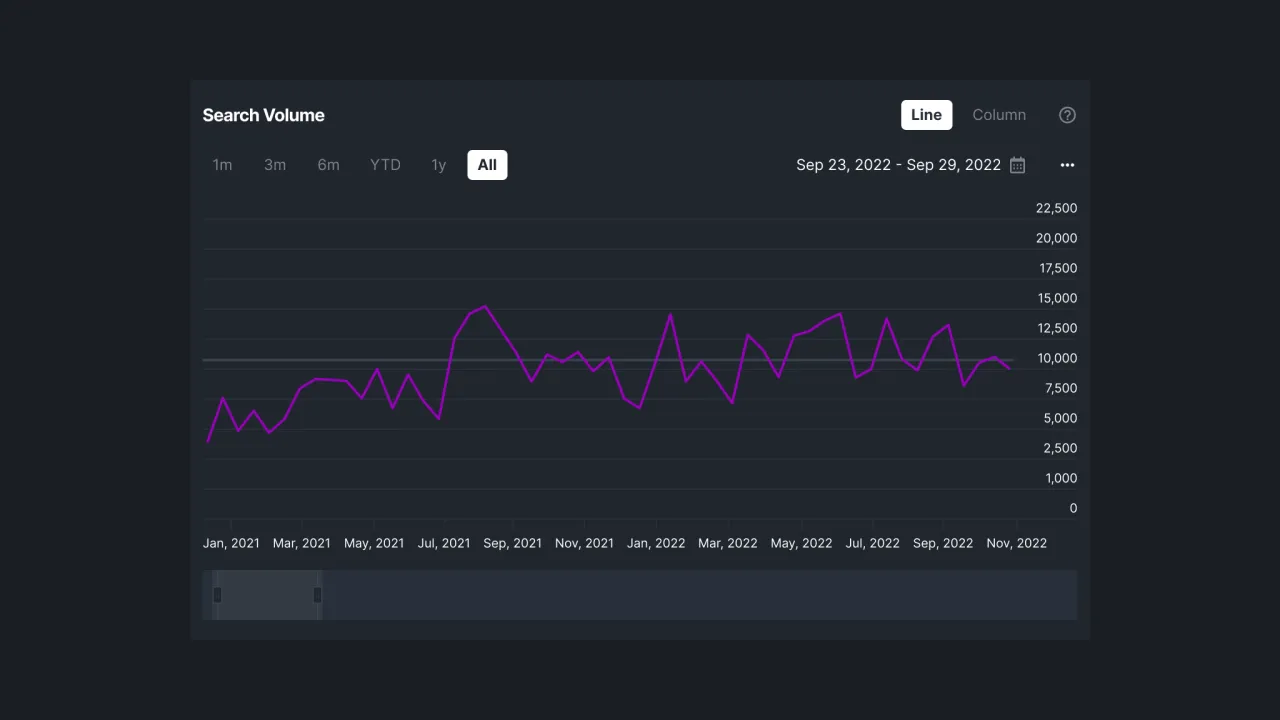
The line graph in Search Volume allows you to view recent data via the Zoom option on the top left side of the graph. If you want to display search volume data based on a specific time period, you can press the calendar icon and specify the selected time period.
The horizontal axis on the graph contains the month and the vertical axis displays the search volume scale. The black solid line on the background of the graph is the average search volume value. You will then see a line graph showing the increase/decrease in keyword search volume each month.
When you hover your mouse over a line in the graph, the system will display the total details of keyword searches in your domain based on the selected line. Not only that, but you will also see the information about the month and year of the selected data.
 |
|---|
| Figure 2 - Search Volume Line chart |
High keyword search volume indicates that the intensity of the keyword search is quite high, so it has the potential to bring traffic to your domain. Through that search volume, you can tell if your domain has targeted the right keywords. Optimize your website with Sequence now!